.svg)


If you deploy consent banners across multiple device types (smartphone, desktop, tablet, or connected TV), you are likely not dealing with a single, uniform user behavior. The device a user is on shapes how they interact with your consent banner, and that interaction directly affects your consent and opt-in rates.
But how significant are those differences, and what should you actually do about them?
What the data says
Based on data collected throughout 2025 and published in our 2026 State of Data Privacy benchmark, consent banner performance varies meaningfully across device types in Europe:
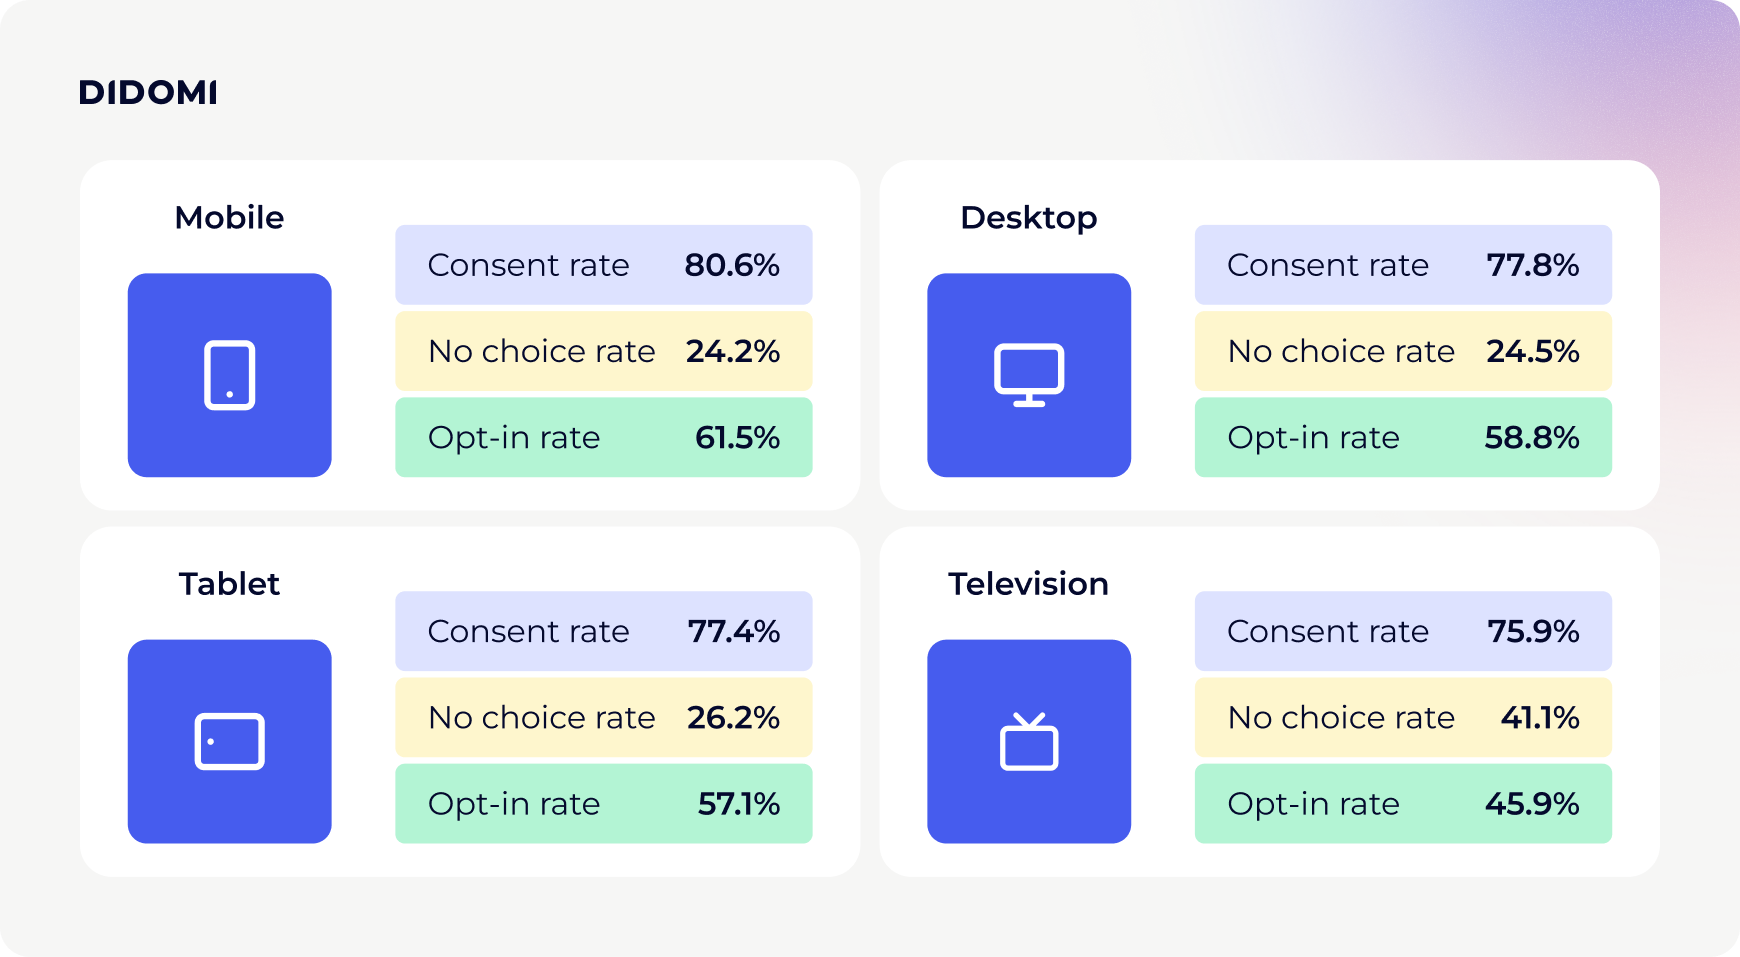
Mobile posts the highest consent rate across all device types at 80.6%, followed by desktop and tablet at 77.8% and 77.4% respectively. Television sits at the bottom for consent rate (75.9%) with the highest no-choice rate of all device types at 41.1%, and the lowest opt-in rate at 45.9%, a pattern that reflects the friction of interacting with a consent banner on a TV interface.
The SDK-level data tells a complementary story. CTV environments record the lowest no-choice rate across SDK types at 14.2%, paired with a strong opt-in rate of 66.4%, suggesting that users who do engage with a consent banner on CTV tend to make an active choice.
(For a full definition of these metrics, see our CMP metrics glossary.)
What does it mean for you?
If your consent rate or opt-in rate on a specific device type falls below the averages above, the gap is worth investigating, but the levers are different depending on the device.
On mobile, banner usability and button sizing are the most common friction points. On desktop, users have more time and screen space, which can work for or against engagement depending on banner design. On television, remote control navigation makes complex banners difficult to explore, which is reflected in the high no-choice rate.
Two things are worth keeping in mind before drawing conclusions from this data:
- Compliance first: Not every configuration that correlates with higher performance in our data is one your legal team would sign off on. Banner design decisions should always be reviewed against applicable regulations before implementation.
- Device type is one variable among many: The figures above reflect aggregate data across a wide range of websites, audiences, and implementations. Your own numbers will be shaped by your content category, user base, and regional regulatory context. Use these benchmarks as orientation, not targets.
The organizations that perform consistently well across both dimensions are those that have stopped treating privacy as a constraint to work around and started treating it as part of the product experience.
Why CTV consent deserves closer attention
One finding worth watching is that only 5.4% of users navigate to the second layer of a consent banner on average, but that figure rises to 6.8% on mobile and 9.4% on CTV. As connected TV continues to grow as an advertising and content delivery environment, consent collection in that context is likely to come under closer regulatory scrutiny. The consent experience on TV is still maturing, and organizations deploying CTV environments should expect expectations around banner usability and transparency to evolve.
Our team at Didomi is actively monitoring developments in CTV consent and will continue to publish updates as the ecosystem evolves.
Learn more in our state of data privacy benchmark
Consent performance by device is just one piece of a much larger dataset.
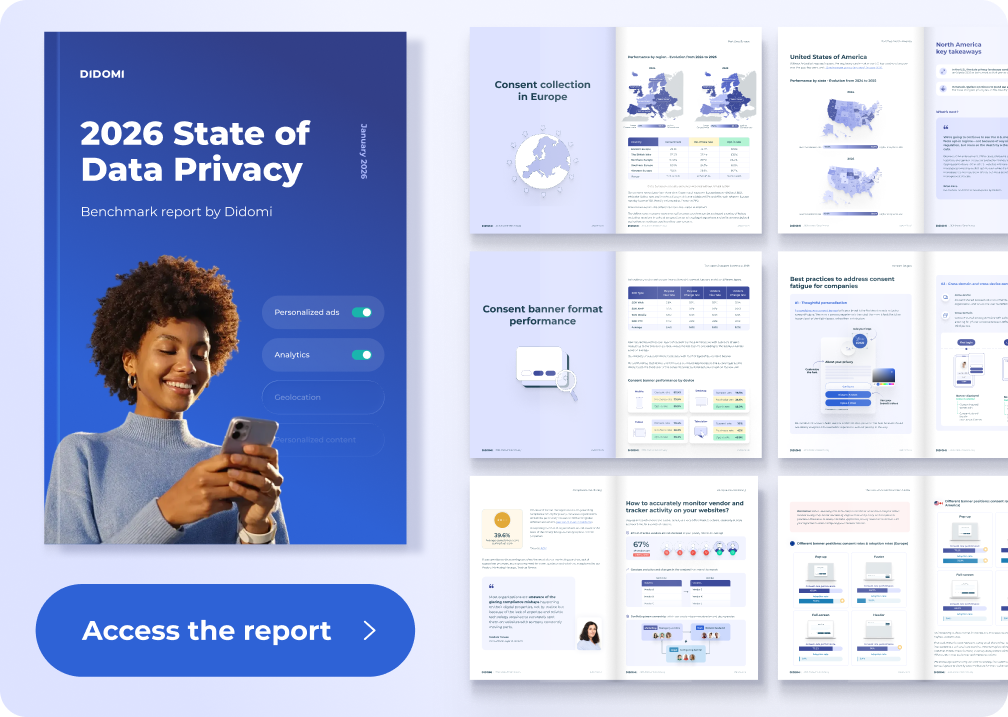
Our 2026 State of Data Privacy benchmark covers consent collection across Europe and North America, banner design and UX, compliance monitoring, and emerging topics including AI and server-side tagging.
Download the full report on our website: